


%20(1).webp)


See the Story Come Together
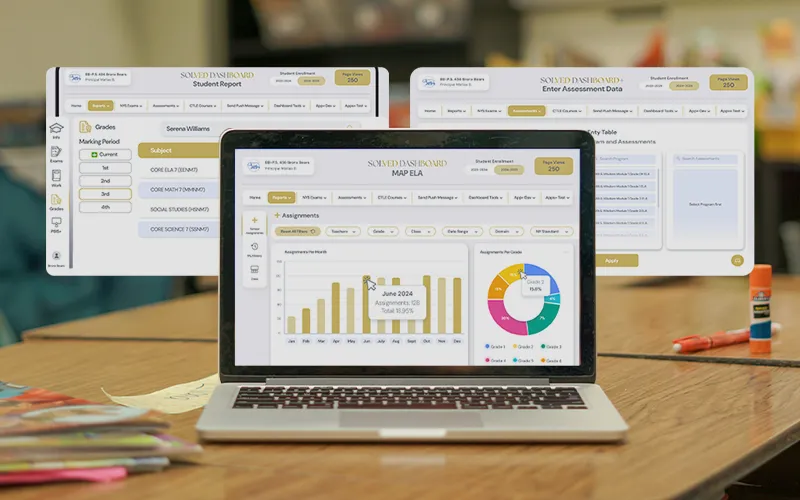
Select a school to see how we bring their brand to life across every touchpoint — school app, website, branding, and professional photo/video.
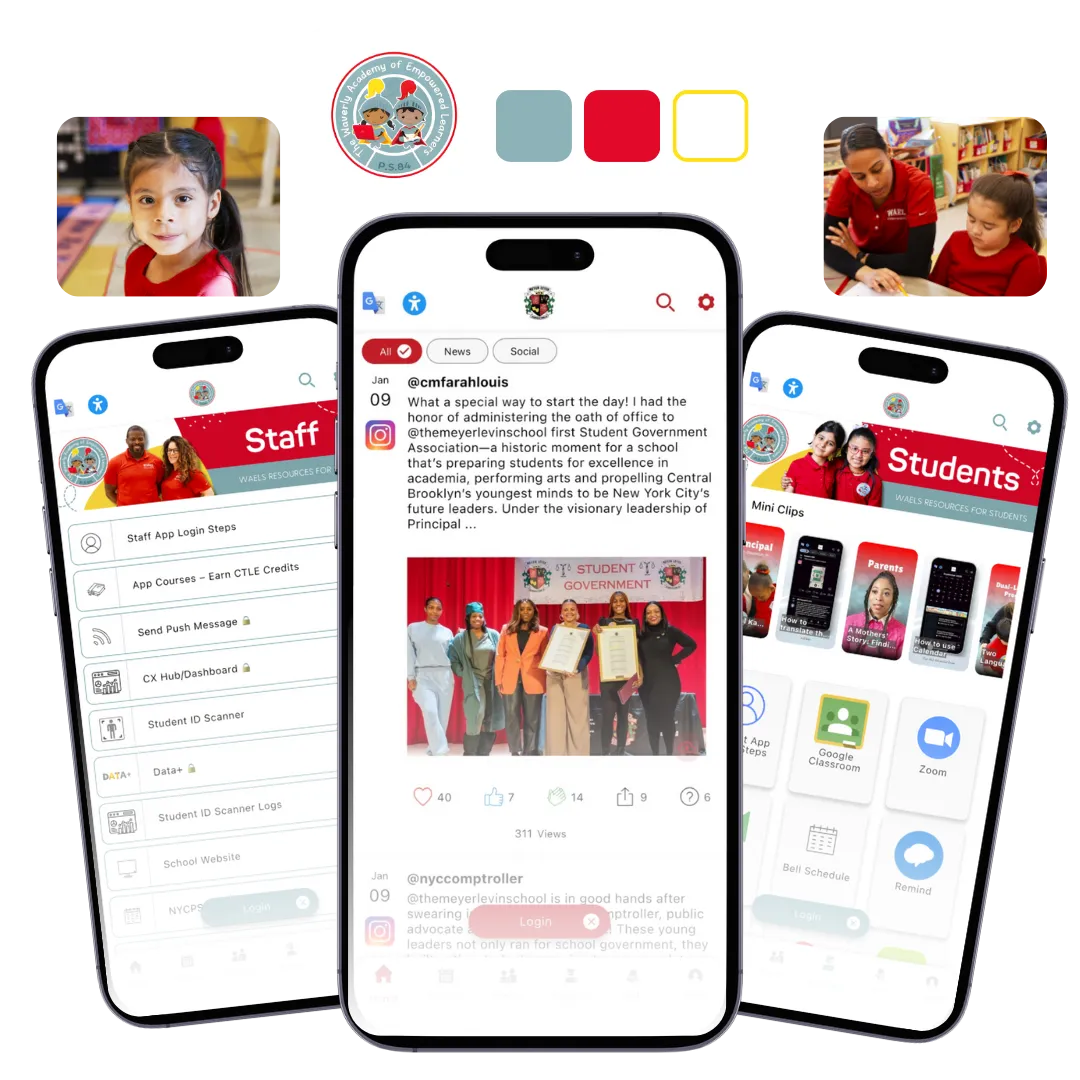
P.S./I.S. 116
P.S./I.S. 116 is a vibrant school community with a lot of personality. We captured authentic moments across classrooms and school life, then built a consistent visual system that carries through their website, school app, and everyday communications — so families experience one clear, uplifting brand everywhere they engage.
.webp)
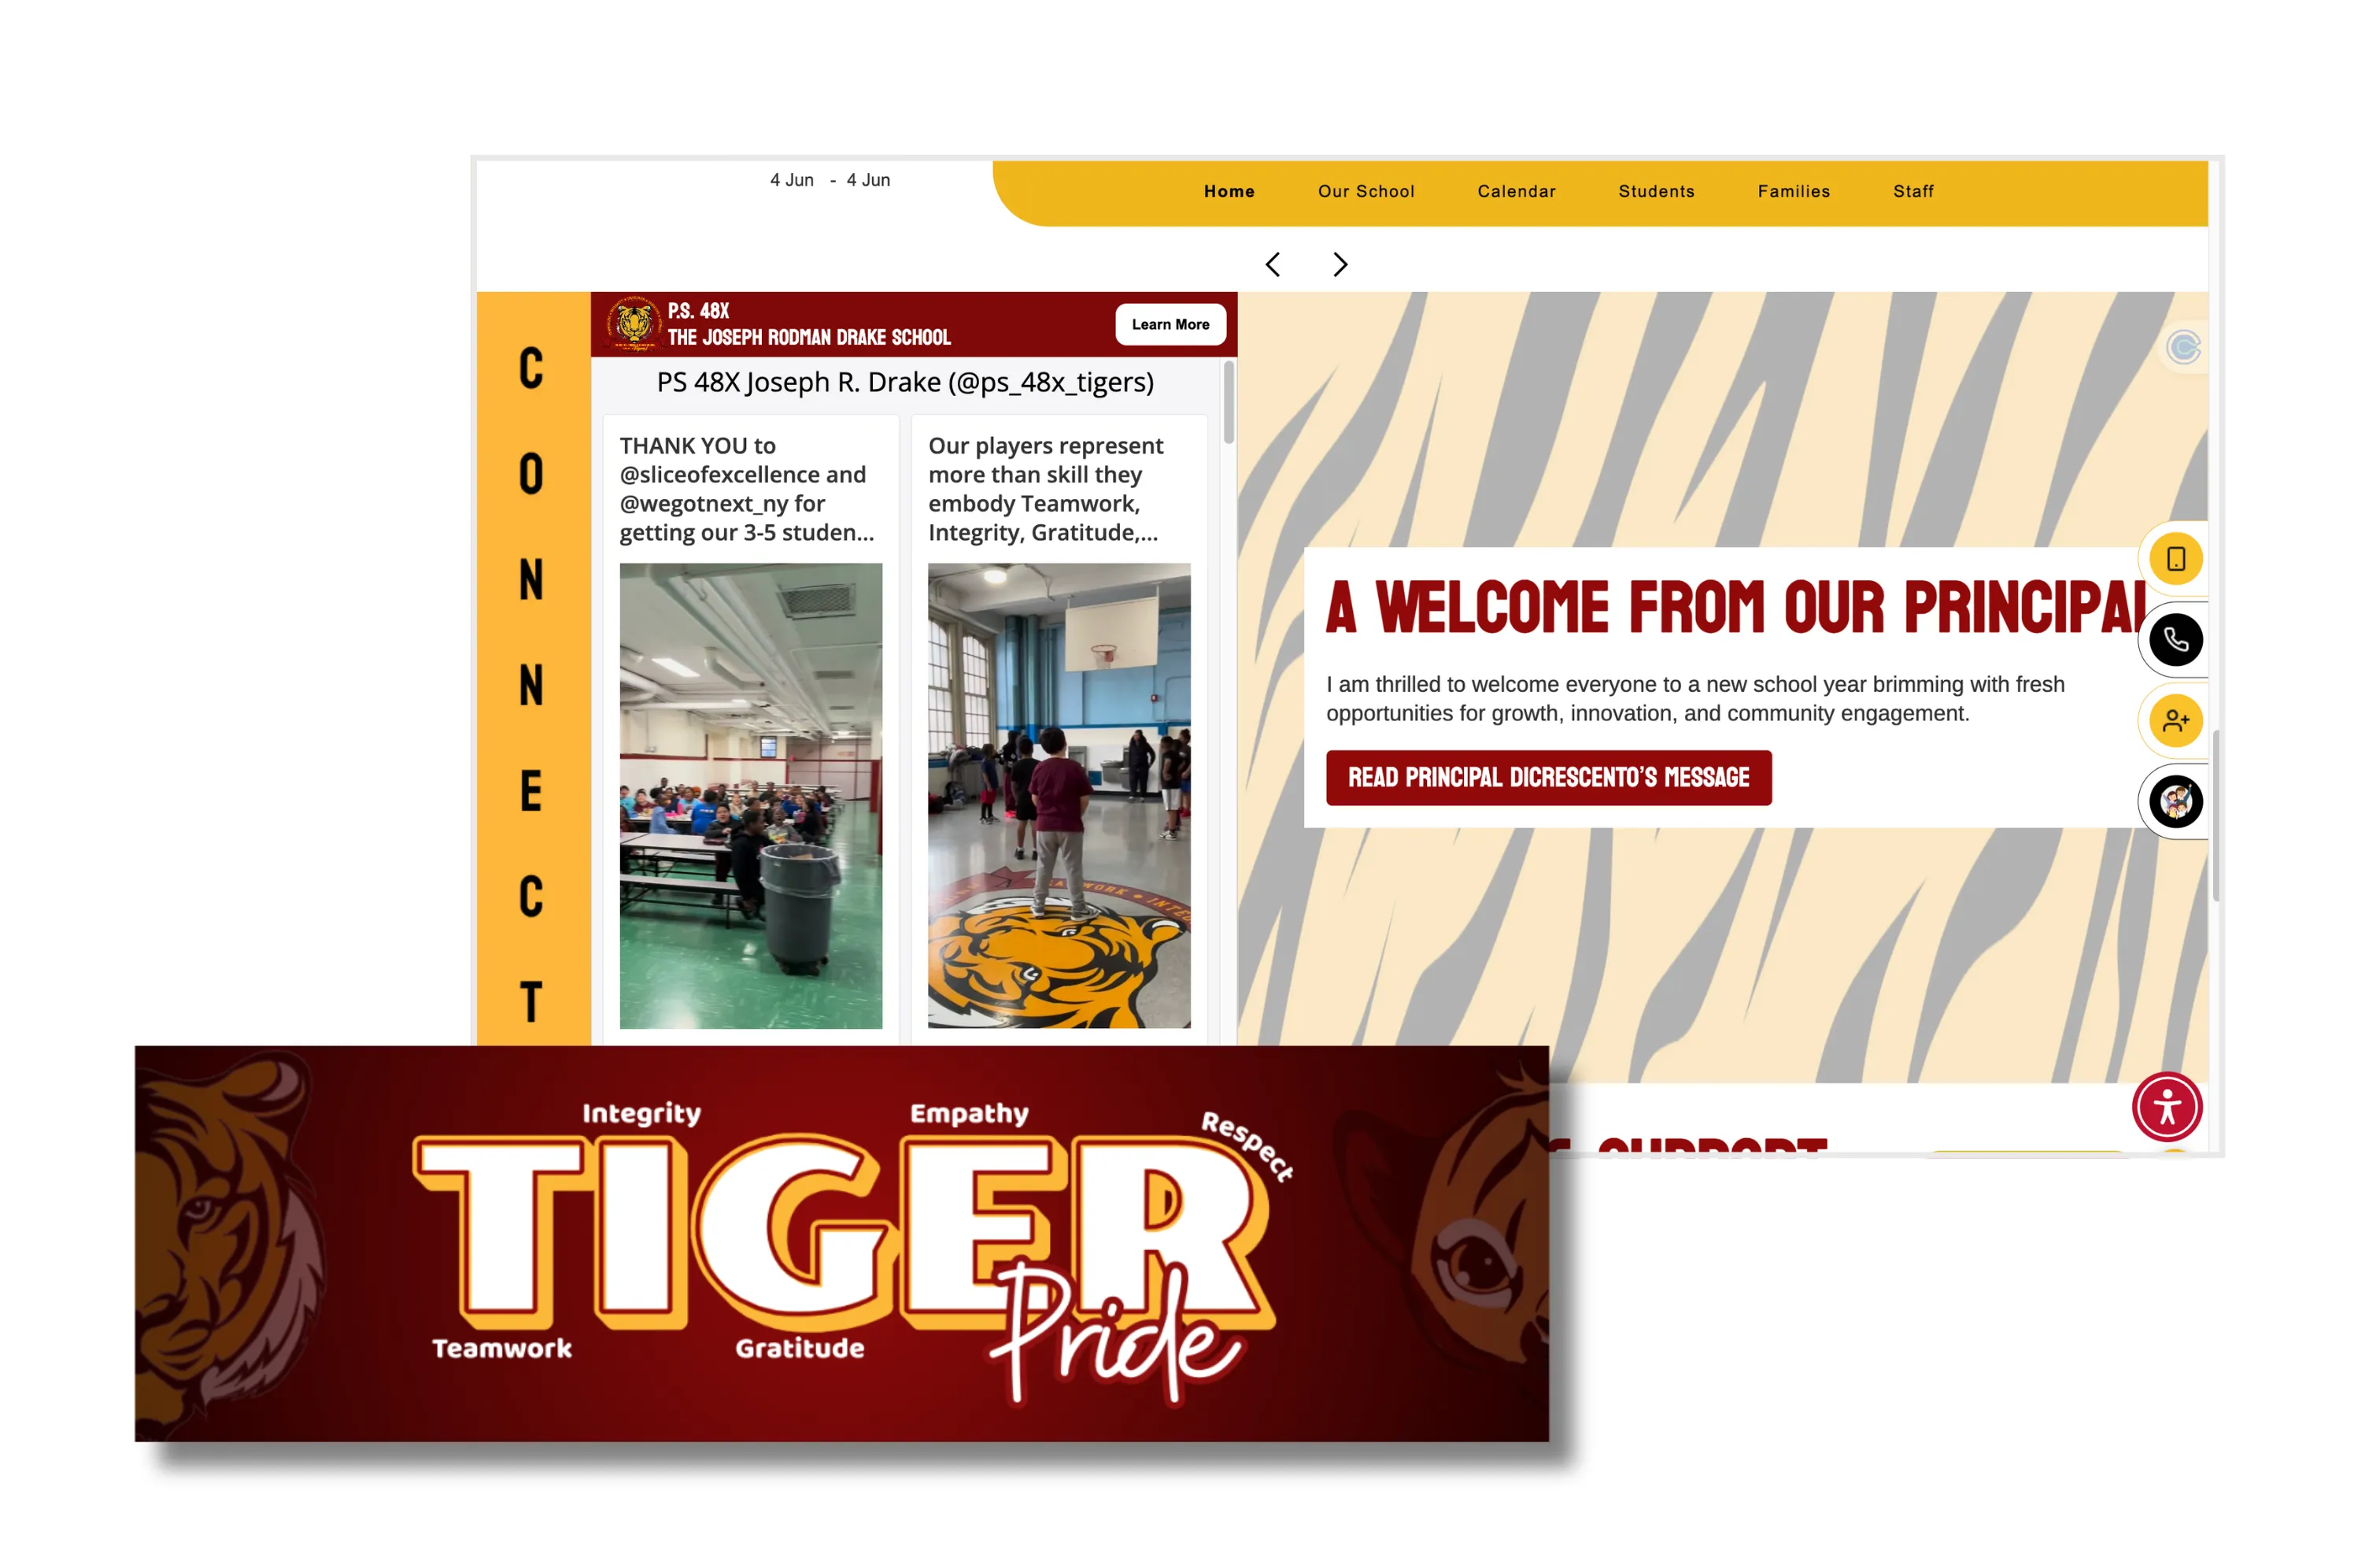
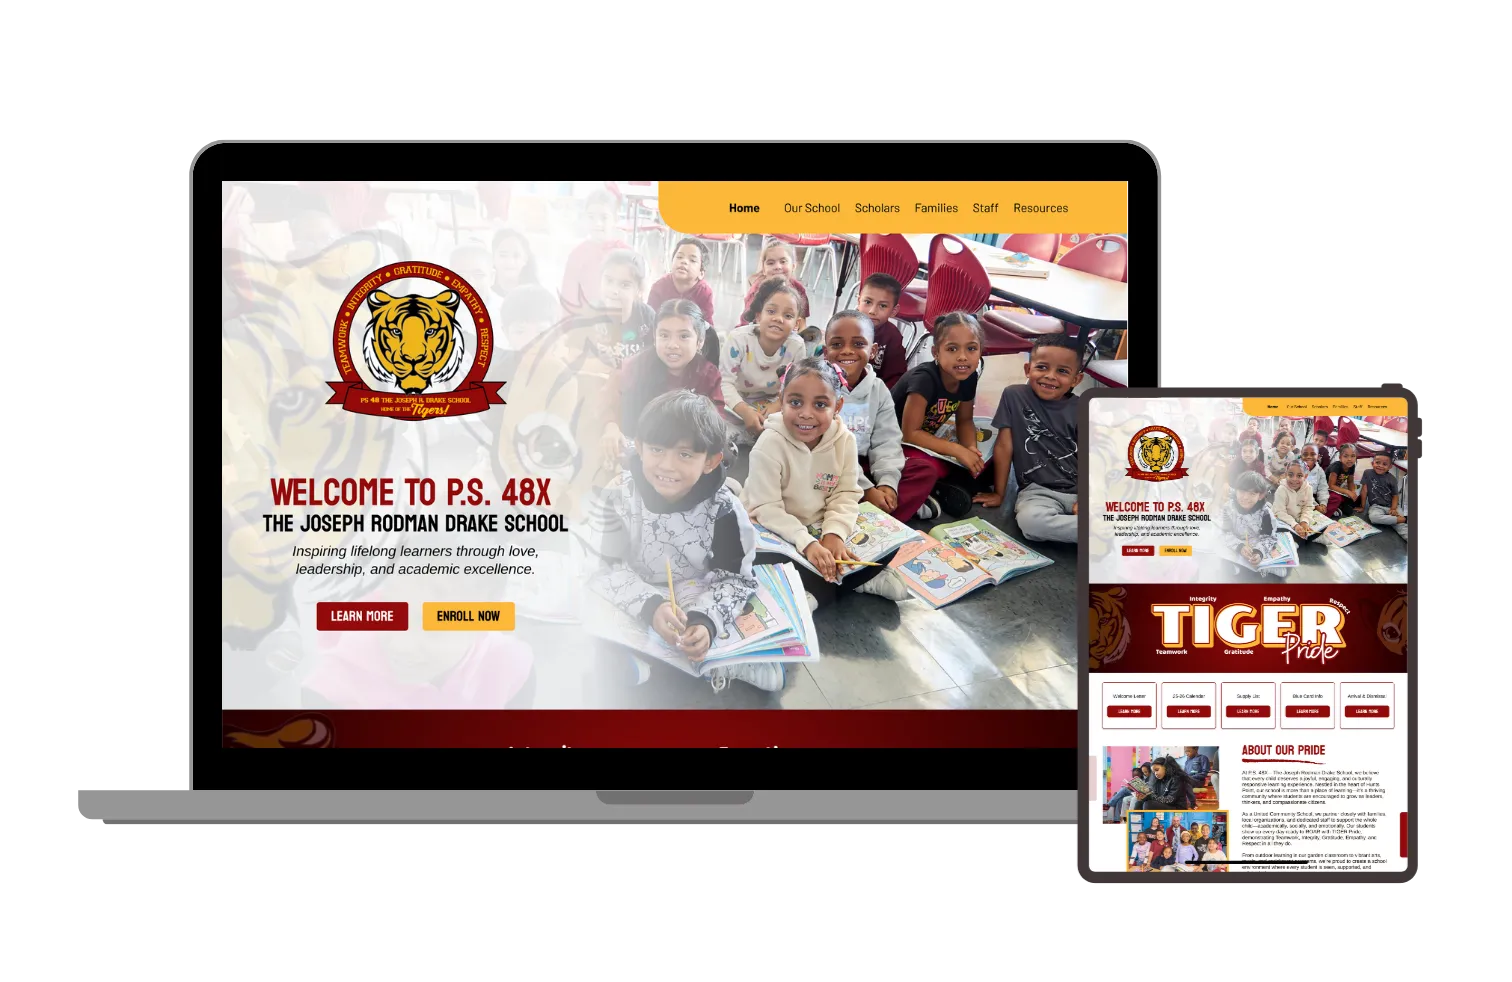
PS 48X Joseph R. Drake
PS 48X Joseph R. Drake needed a digital presence that feels as welcoming and organized as the school itself. We photographed staff and day-to-day learning moments, then applied that visual library across a refreshed website and school app — creating a unified look that stays consistent across announcements, programs, and family-facing updates.
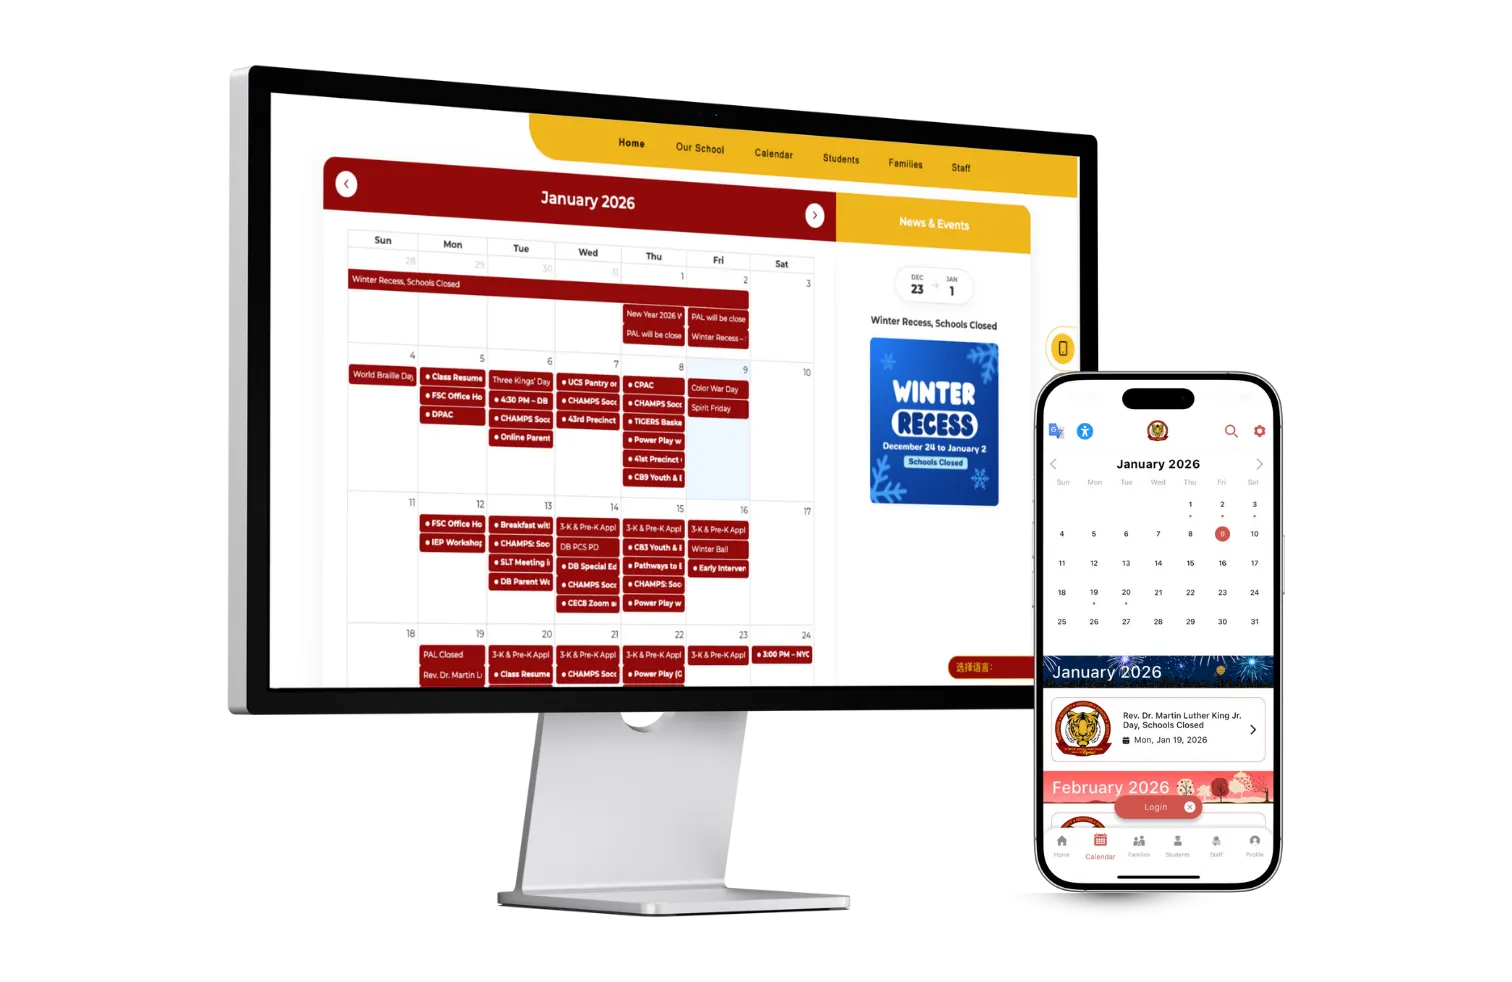
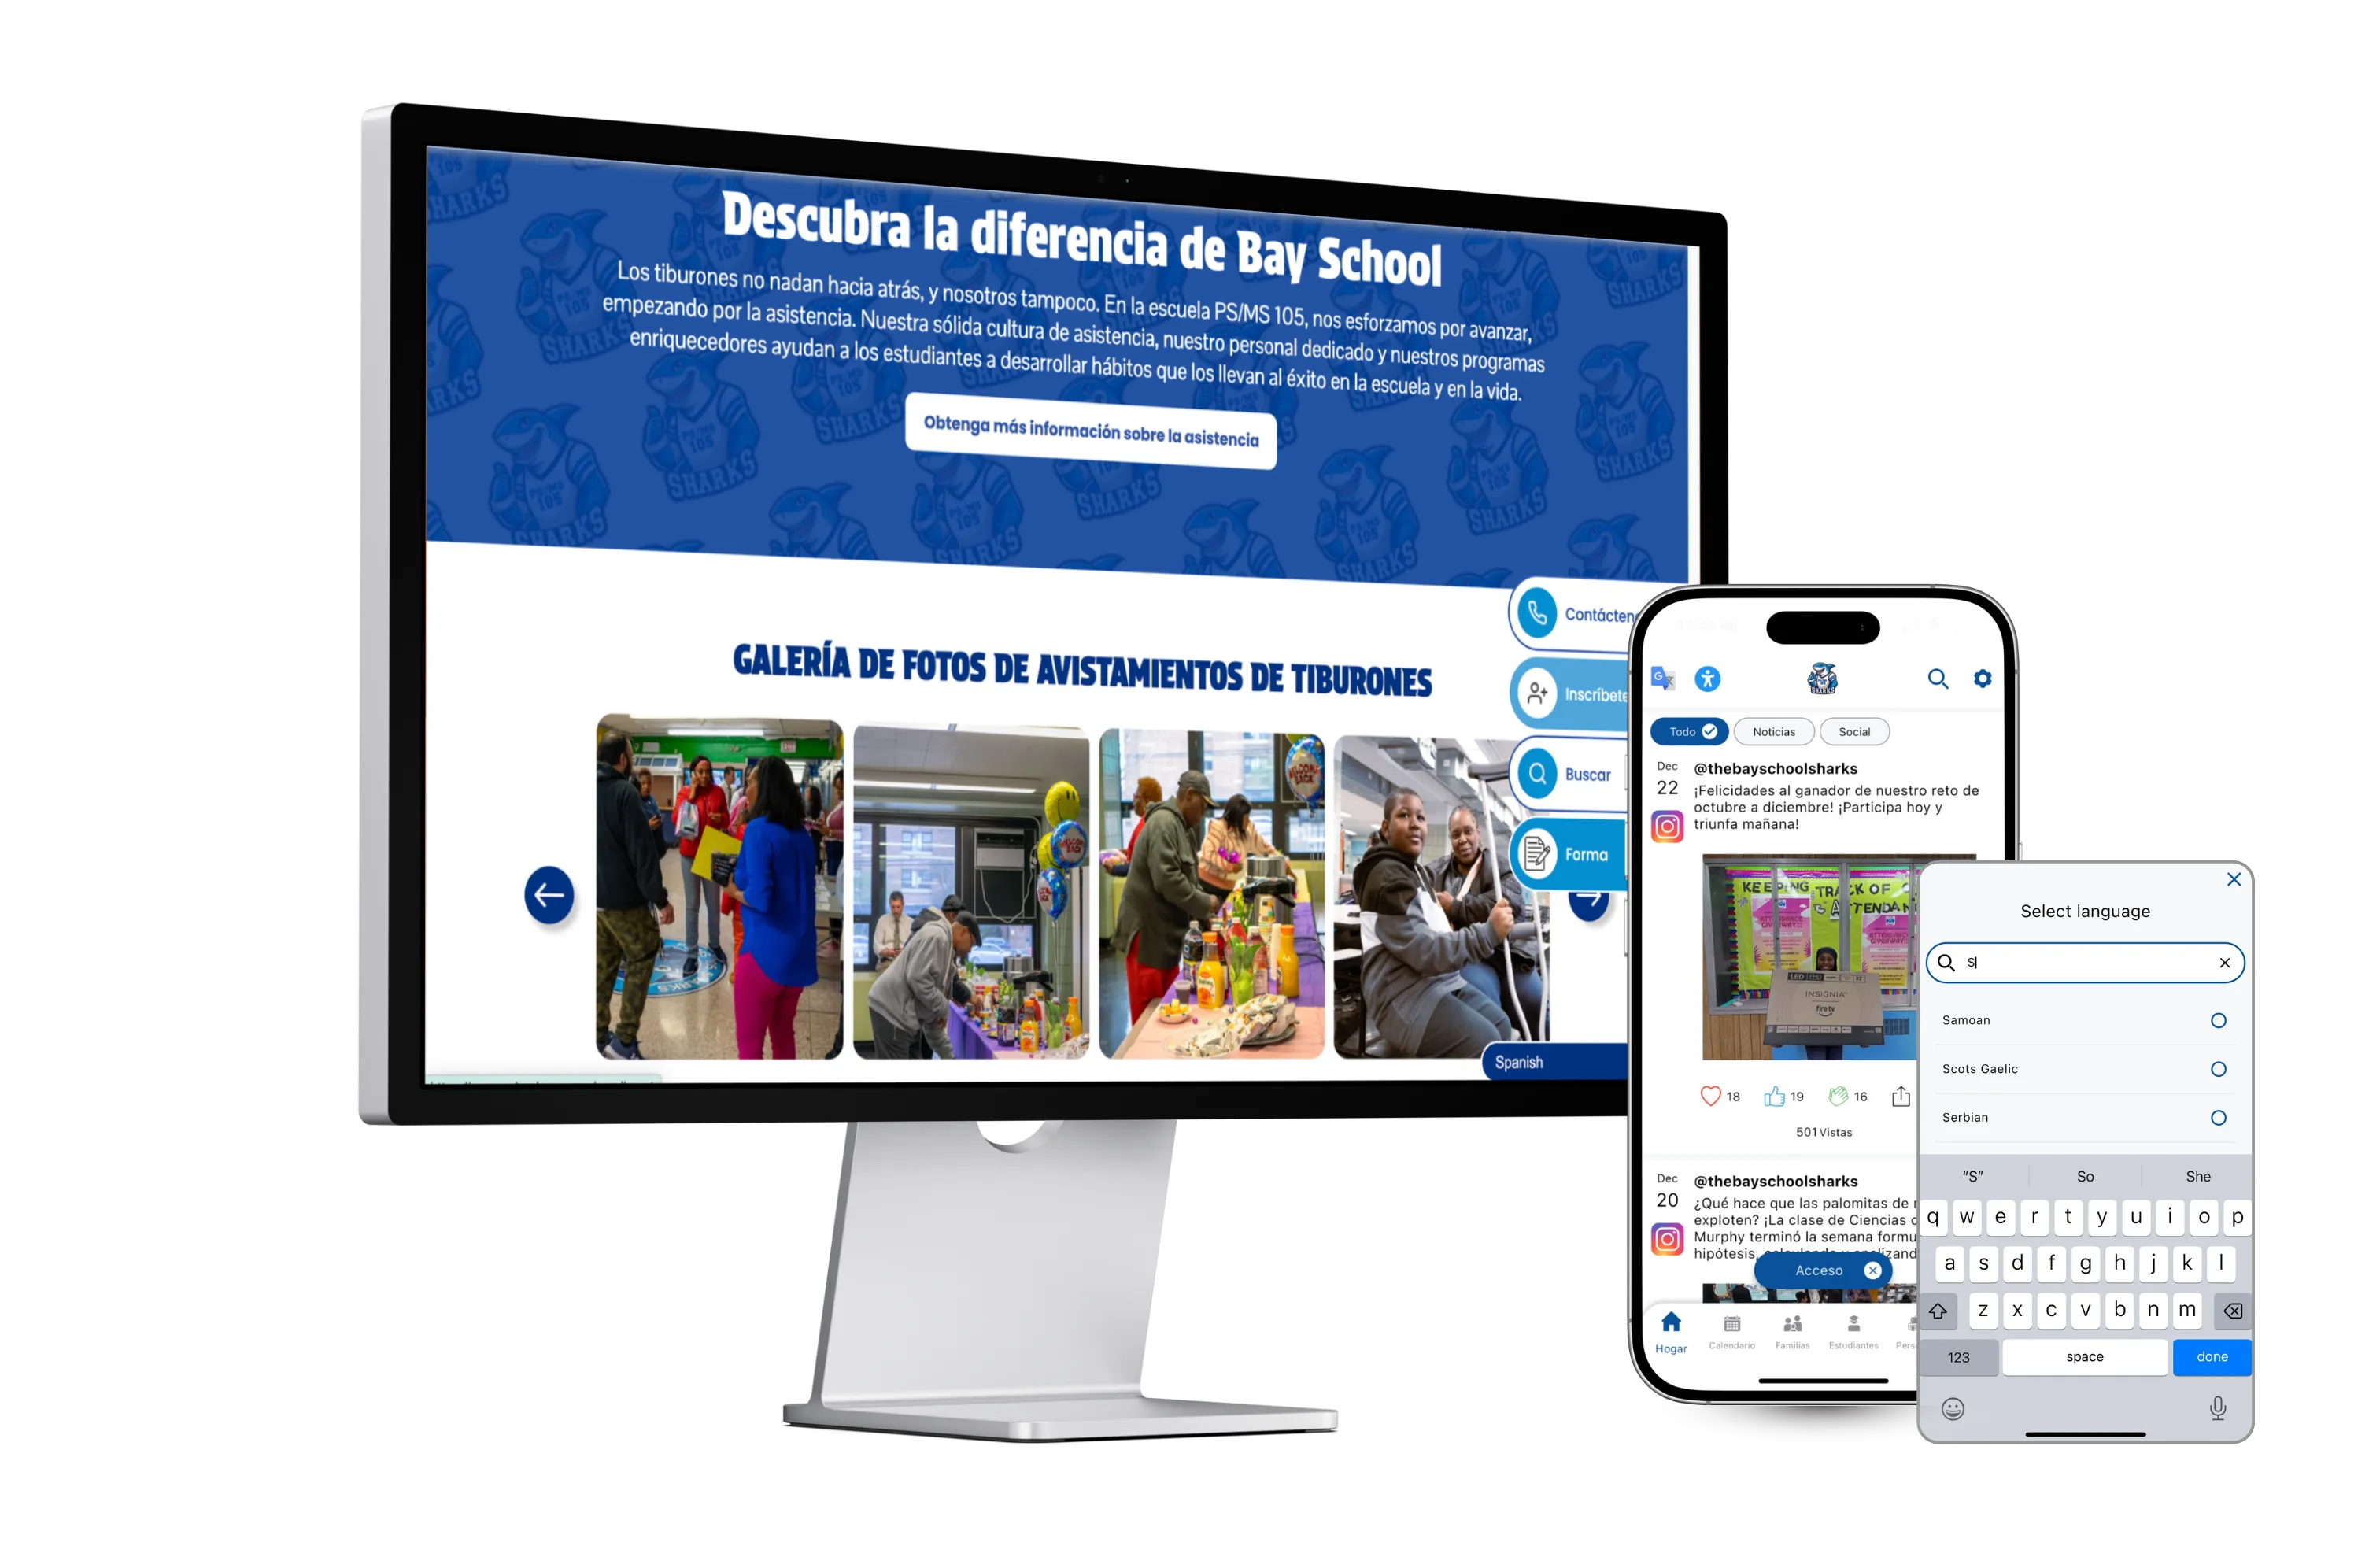
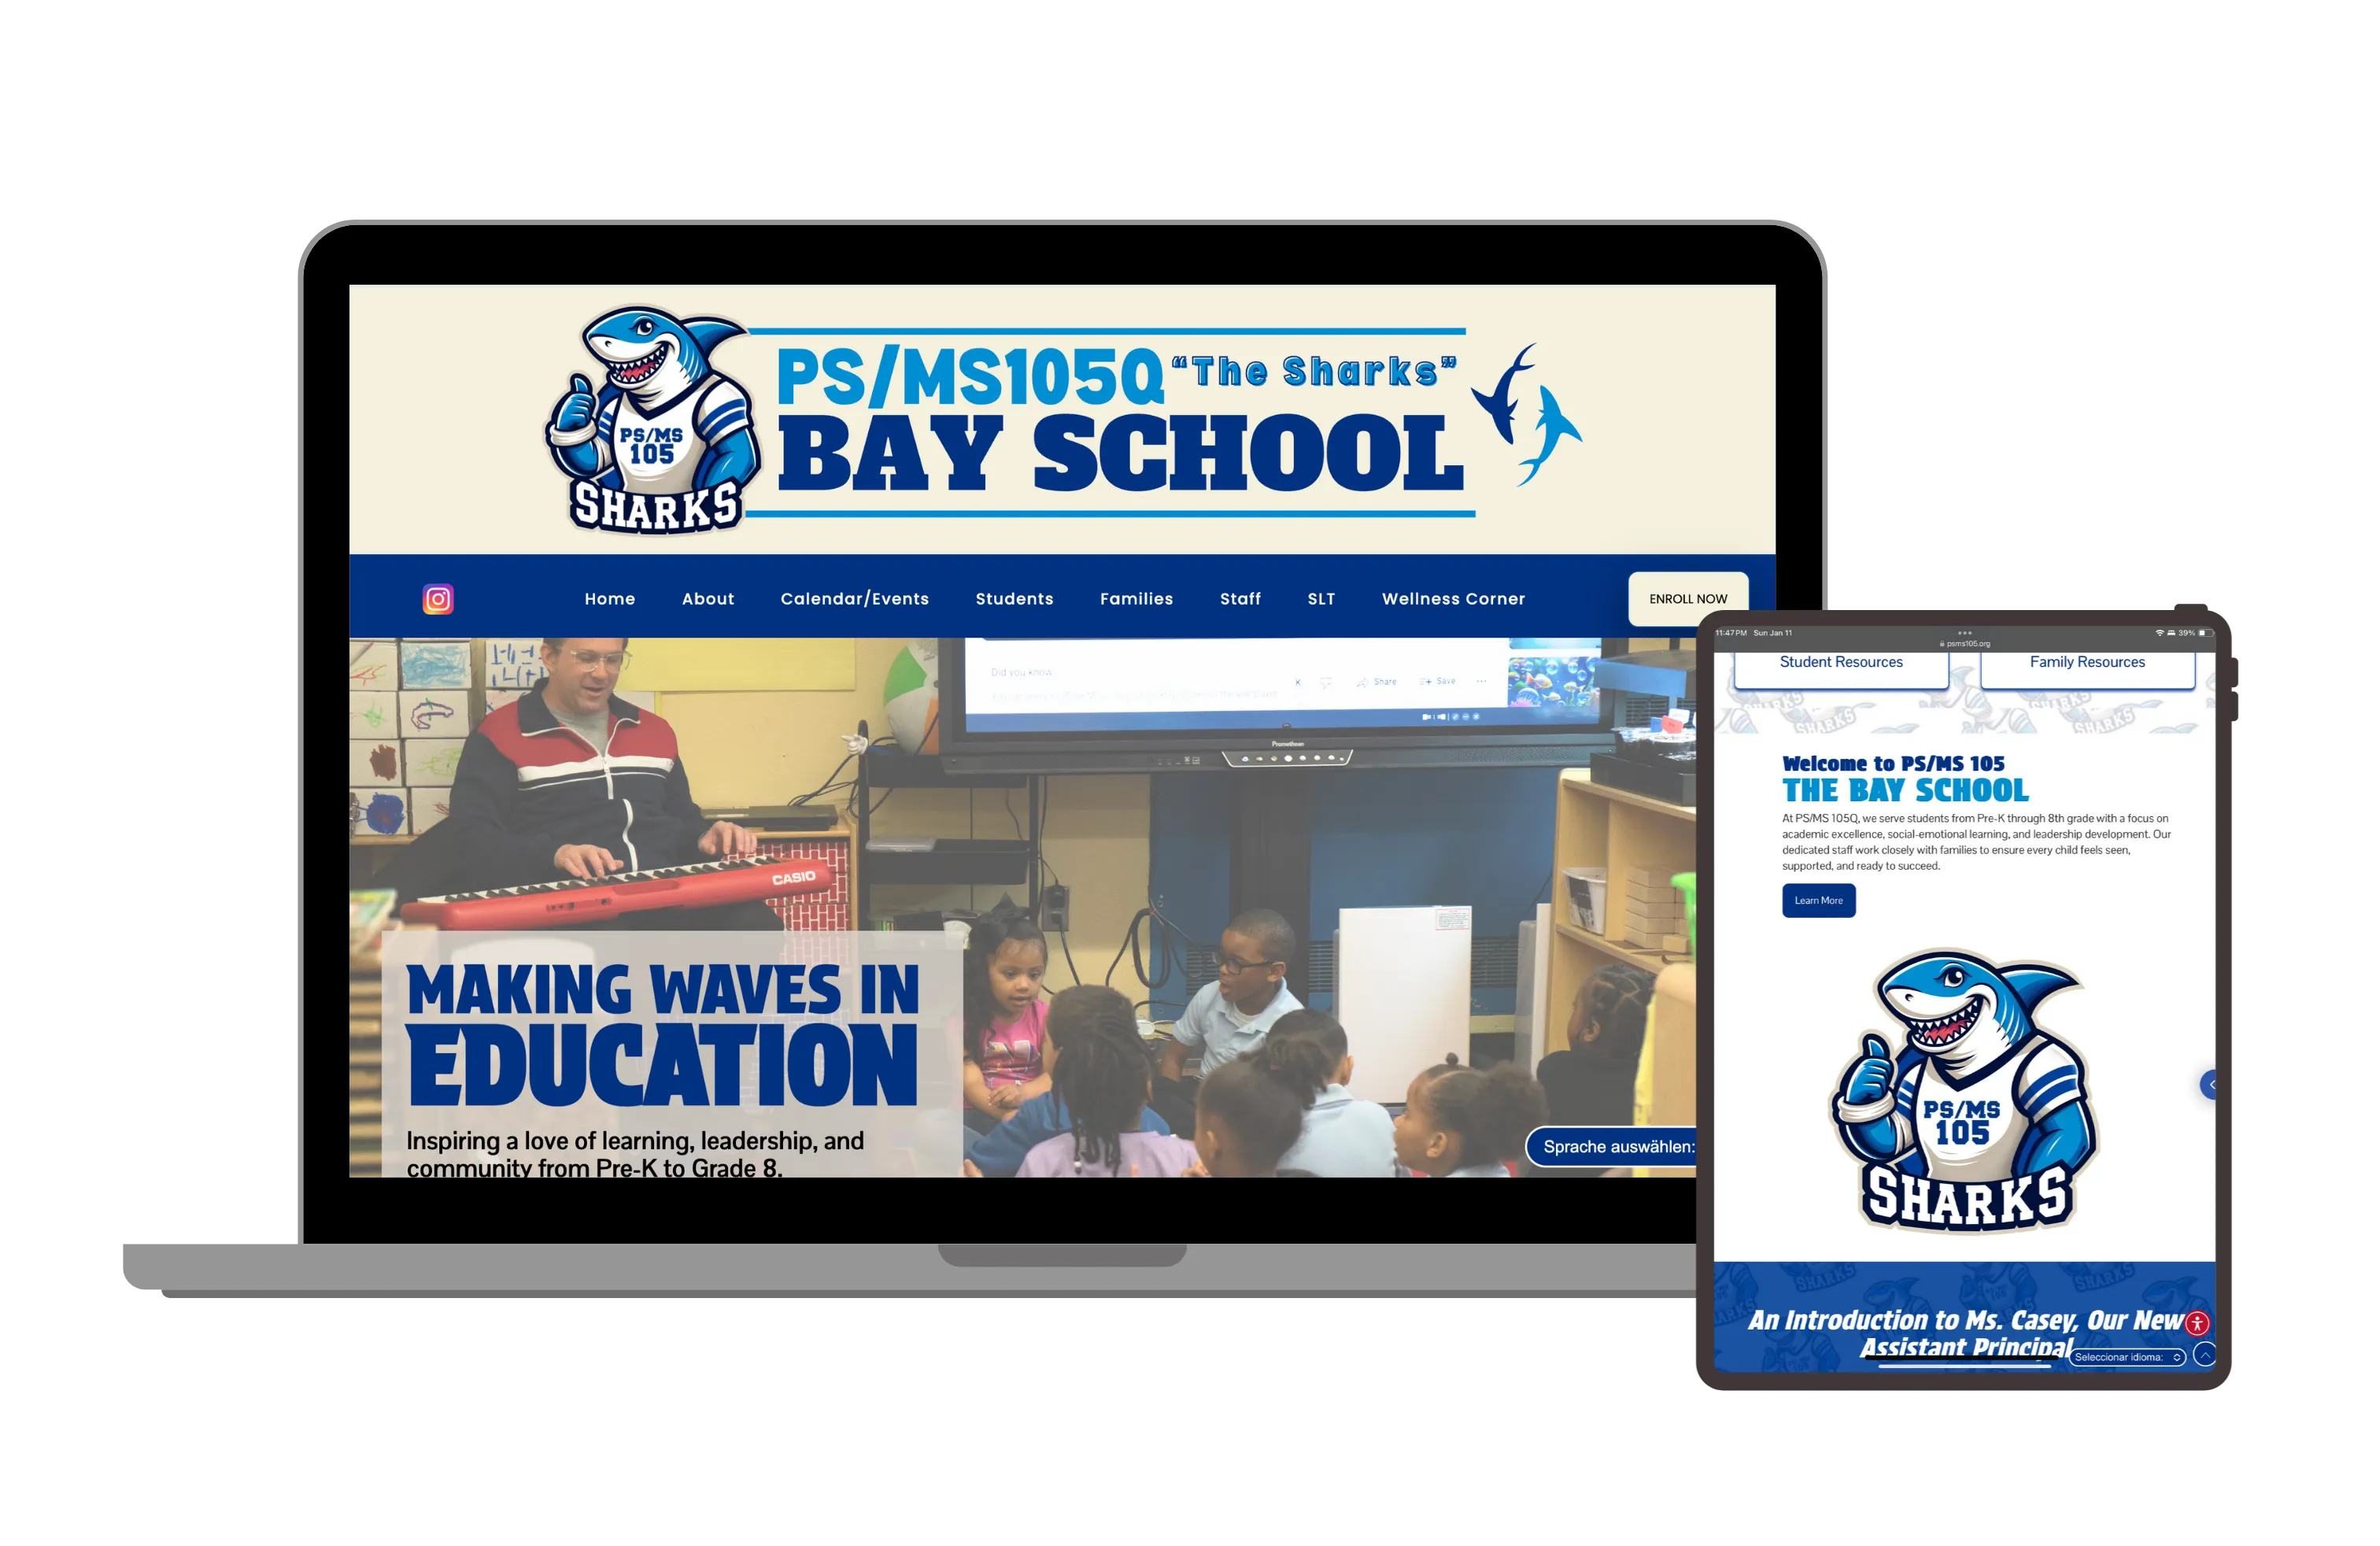
PS/MS 105 The Bay School
PS/MS 105Q The Bay School required one cohesive identity across every digital touchpoint. We paired a brand-forward design approach with updated website and app visuals, supported by professional photography — so the school’s story feels consistent, modern, and instantly recognizable wherever families interact with it.
.webp)

.webp)